Debug Probe for Raspberry Pi Pico 2
Pressing the BOOTSEL button every time you want to flash a new program is annoying. On devboards like the ESP32 DevKit this step is mostly automatic because the devboard can reset the chip into bootloader mode when needed. The Pico 2 does not have this feature, but you can get the same convenience and even more capability by using a debug probe.
This chapter explains why a debug probe is helpful, and step-by-step how to set one up and use it to flash and debug your Pico 2 without pressing BOOTSEL each time.
Raspberry Pi Debug Probe
The Raspberry Pi Debug Probe is the official tool recommended for SWD debugging on the Pico and Pico 2. It is a small USB device that acts as a CMSIS-DAP adapter. CMSIS-DAP is an open standard for debuggers that lets your computer talk to microcontrollers using the SWD protocol.
The probe provides two main features:
-
SWD (Serial Wire Debug) interface - This connects to the Pico’s debug pins and is used to flash firmware and perform real time debugging. You can set breakpoints, inspect variables, and debug your program just like you would in a normal desktop application.
-
UART bridge - This provides a USB to serial connection so you can view console output or communicate with the board.
Both features work through the same USB cable that goes into your computer, which keeps the setup simple because you do not need a separate UART device.
Soldering SWD Pins
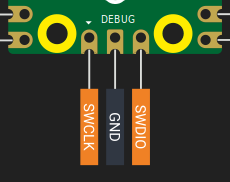
Before you can connect the Debug Probe to the Pico 2, you need to make the SWD pins accessible. These pins are located at the bottom edge of the Pico board, in a small 3-pin debug header separate from the main GPIO pins.
Once the SWD pins are soldered, your Pico is ready to connect to the Debug Probe.
Preparing Debug Probe
Your Debug Probe may not ship with the latest firmware, especially the version that adds support for the Pico 2 (RP2350 chip). Updating the firmware is recommended before you start.
The official Raspberry Pi documentation provides clear instructions for updating the Debug Probe. Follow the steps provided.
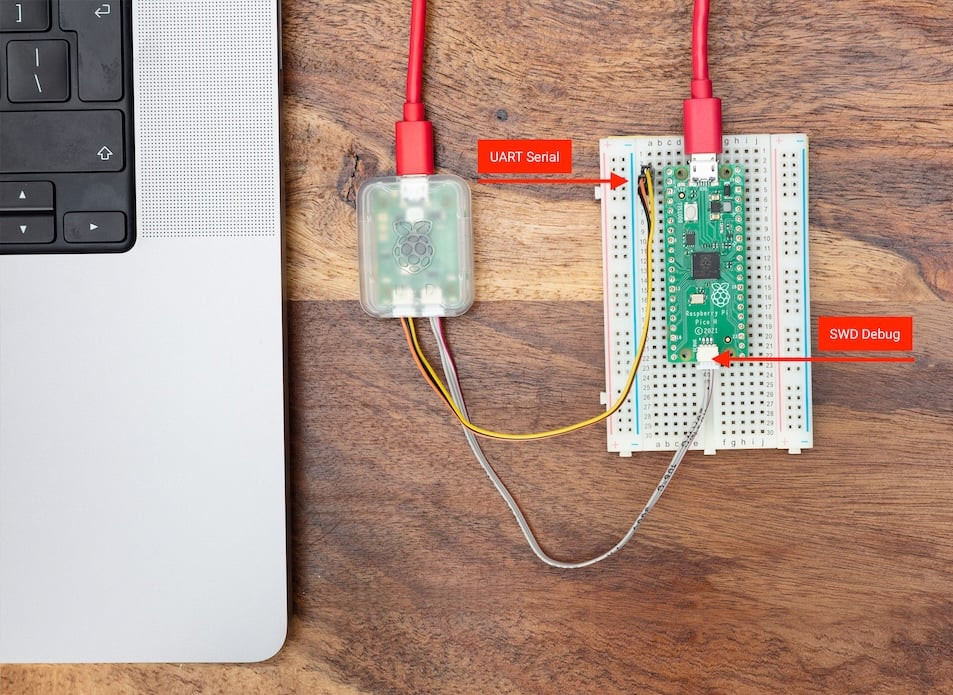
Connecting Pico with Debug Probe
The Debug Probe has two ports on its side:
- D port - For the SWD (debug) connection
- U port - For the UART (serial) connection
SWD Connection (Required)
The SWD connection is what allows flashing firmware and using a debugger. Use the JST to Dupont cable that comes with your Debug Probe.
Connect the wires from the Debug Probe’s D port to the Pico 2 pins as follows:
| Probe Wire | Pico 2 Pin |
|---|---|
| Orange | SWCLK |
| Black | GND |
| Yellow | SWDIO |
Make sure the Pico 2 SWD pins are properly soldered before you attempt the connection.
UART Connection (Optional)
The UART connection is useful if you want to see serial output (like println! logs from Rust) in your computer’s terminal. This is separate from the SWD connection.
Connect the wires from the Debug Probe’s U port to the Pico 2 pins:
| Probe Wire | Pico 2 Pin | Physical Pin Number |
|---|---|---|
| Yellow | GP0 (TX on Pico) | Pin 1 |
| Orange | GP1 (RX on Pico) | Pin 2 |
| Black | GND | Pin 3 |
You can use any GPIO pins configured for UART, but GP0 and GP1 are the Pico’s default UART0 pins.
Powering the Pico
The Debug Probe does not supply power to the Pico 2, it only provides the SWD and UART signals. To power the Pico 2, connect the Debug Probe to your PC through its USB port, then power the Pico 2 separately through its own USB connection. Both devices must be powered for debugging to work properly.
Final Setup
Once connected:
- Plug the Debug Probe into your computer via USB
- Ensure your Pico 2 is powered
- The Debug Probe’s red LED should light up, indicating it has power
- Your setup is ready - no BOOTSEL button pressing needed from now on
You can now flash and debug your Pico 2 directly through your development environment without any manual intervention.
Test it
To verify that your Debug Probe and Pico 2 are connected correctly, you can use the quick start project. Flash it and test that everything works.
git clone https://github.com/ImplFerris/pico2-quick
cd pico2-quick
You cannot just use cargo run like we did before, unless you modified the config.toml. Because the quick start project is set up to use picotool as its runner. You can comment out the picotool runner and enable the probe-rs runner. Then you can use the cargo run command.
Or more simply (I recommend this), you can just use the following commands provided by probe-rs. This will flash your program using the Debug Probe:
cargo flash
# or
cargo flash --release
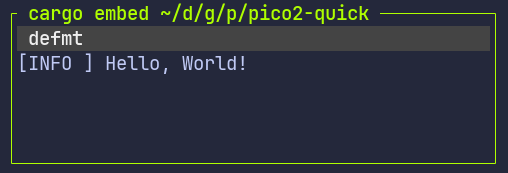
cargo embed
You can use cargo embed to flash your program and watch the log output in your terminal. The quick start project is already set up to send its log messages over RTT, so you do not need to configure anything before trying it out.
cargo embed
# or
cargo embed --release
If RTT is new to you, we will explain it later, but for now you can simply run the command to see your program run and print logs.
If everything works, you should see the “Hello, World!” message in the system terminal.
Use standard [Ctl]-[C] to exit this terminal.